
TIER 2 · BUDGET BUILD · 2027 PHARMACY TREND
Your PBM Will Hand You a 2027 Number.
Build Yours First.
A 2-page printable worksheet that breaks a pharmacy trend projection into its four inputs, with a source you control and a question to ask for each. Free download. Sent to your inbox.
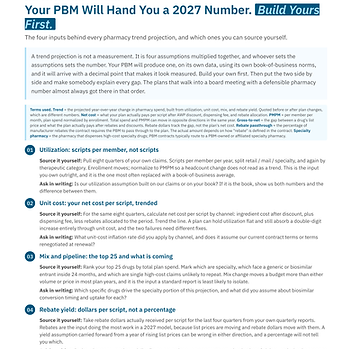
The 4 inputs behind every trend projection, and which 2 you already own
A self-sourced method for each: utilization, unit cost, mix, rebate yield
Paste-ready assumption request to send your PBM before you accept a number
October to December sequence ending at the board meeting
Get the Worksheet
PDF arrives in your inbox in about 2 minutes
Welcome back! Get this one instantly:
Get the Worksheet
PDF arrives in your inbox in about 2 minutes
Please check your details and try again.
You're set — the toolkit is on its way to your inbox.
Built by Prescription Benefit Solutions, an independent pharmacy benefits consultancy. In 2025: 132 pharmacy benefit reviews for self-funded employers, averaging $469,000 in contracted savings per client.
A complete audit framework you can run in half a day.
WHAT IS IN THE WORKSHEET
PASS 03
The Rebate Assumption, in Dollars
Rank your top 25 drugs by total plan spend and mark three things on each: specialty or not, facing a generic or biosimilar entrant inside 24 months, and single high-cost claims unlikely to repeat. Mix change moves a pharmacy budget more than either volume or price in most plan years, and it is the input a standard PBM report is least likely to separate out. The worksheet pairs the pull with the question to send: which specific drugs drive the specialty portion of this projection, and what did you assume about biosimilar conversion timing and uptake for each.
PASS 01
The Two Inputs You Already Own
Utilization and unit cost both sit in your own claims and need nobody's permission. The worksheet specifies exactly how to pull each: scripts per member per year across eight quarters, split retail, mail and specialty and again by therapeutic category, normalized to PMPM so an enrollment change does not read as a trend; then net cost per script by channel, ingredient cost after discount plus dispensing fee less rebates allocated to the period, trended over the same eight quarters. Isolating them is diagnostic, because a plan can hold utilization flat and absorb a double-digit increase entirely through unit cost, and those two failures need completely different fixes.
PASS 02
Mix, and the Input a Report Will Not Isolate
Rank your top 25 drugs by total plan spend and mark three things on each: specialty or not, facing a generic or biosimilar entrant inside 24 months, and single high-cost claims unlikely to repeat. Mix change moves a pharmacy budget more than either volume or price in most plan years, and it is the input a standard PBM report is least likely to separate out. The worksheet pairs the pull with the question to send: which specific drugs drive the specialty portion of this projection, and what did you assume about biosimilar conversion timing and uptake for each.
ACTION PLAN
A Range for the Board, and the Paste-Ready Request
The worksheet closes with the two assumptions to challenge in writing, the rebate assumption and the split between the projection before plan changes and the projection after, then builds three cases: low, expected and high, each tied to one named variable and the month that variable becomes visible. A paste-ready six-item assumption request goes to the PBM as-is. The October, November, December sequence ends at the board meeting with the assumptions recorded, which is what turns an April variance into a conversation about a trigger you already named.